The Raw Card Pricing Playbook - Part 5 - Card Context
Cass Sapir
Market price is only the starting point. To price raw cards smarter, dealers need to understand the card itself: the player, set, year, scarcity, rookie status, autograph, memorabilia, and current demand. This final chapter of the Raw Card Pricing Playbook shows how card context can turn a basic comp into a better pricing decision.

Card Context: Why the Card Itself Should Change Your Price
So far in the Raw Card Pricing Playbook, we have looked at pricing from a few different angles.
We started with the relationship between sale price and market price.
Then we looked at how pricing behavior changes by market value tier.
Then we looked at price endings and whether cards listed at clean prices, charm prices, or odd prices perform differently.
Then we added liquidity — the idea that a card with strong demand and limited supply should be priced differently than a card with lots of active competition.
Now we are adding the final layer in the pricing model:
Card context.
This is where pricing gets smarter than a formula.
A card is not just a market price.
It is a card of a specific player, from a specific set, from a specific year, with a specific role in the hobby.
That matters.
A $4 raw card of Bobby Witt Jr. is not the same pricing decision as a $4 raw card of a no-name veteran.
But even that is not enough.
A Bobby Witt Jr. base Rookie Debut is not the same pricing decision as a Bobby Witt Jr. flagship rookie, Chrome rookie, numbered parallel, short print, autograph, memorabilia card, or card from a brand-new release.
The player matters.
The set matters.
The card type matters.
The scarcity matters.
The current hobby moment matters.
That is what we mean by card context.
Start With the Player
The first layer of card context is the player.
Before a dealer decides whether to list a card below market, at market, or above market, they should ask a simple question:
How much demand is there for this player relative to the amount of supply already listed?
To study that, we built a player-demand report that groups all cards by player and compares:
Total cards sold over the past year
Total active cards currently listed
Demand / supply ratio
The demand / supply ratio is calculated as:
cards sold over the past year ÷ active cards listed
A higher number means demand is strong relative to the current listed supply.
A lower number means there are many more cards listed than buyers have recently purchased.
You can also think about this as years of supply.
If a player has 10,000 active cards listed and 5,000 cards sold over the past year, that is a demand / supply ratio of 0.50. At the current sales pace, there is roughly two years of supply already listed.
If a player has 10,000 active cards listed and only 1,000 cards sold over the past year, the ratio is 0.10. That means there is roughly ten years of supply already listed.
That does not mean it will literally take ten years to sell every card. New demand can appear, supply changes, and not every listing is priced correctly.
But it is a useful way to think about market pressure.
The higher the ratio, the more pricing power a dealer may have.
The lower the ratio, the more careful the dealer should be about pricing above market.
Player Demand Is Not the Same as Player Fame
One of the most important lessons from the data is that a famous player is not always the same thing as a high-demand pricing opportunity.
Some players are extremely well known, but they also have enormous supply.
That matters.
For example, players like Michael Jordan, LeBron James, Tom Brady, Patrick Mahomes, Mike Trout, Nolan Ryan, and Ken Griffey Jr. all have major collector demand.
But they also have massive amounts of inventory listed.
That creates a different pricing environment than a hot new player with limited supply.
A common card of a famous player may still need to be priced competitively if there are thousands of similar cards already available.
Here are a few examples from the player-demand report:
Player | Sold Past Year | Active Listings | Demand / Supply Ratio | Approx. Years of Supply |
|---|---|---|---|---|
Shohei Ohtani | 31,529 | 55,451 | 0.57 | 1.8 years |
Victor Wembanyama | 10,541 | 19,151 | 0.55 | 1.8 years |
Kobe Bryant | 9,082 | 22,051 | 0.41 | 2.4 years |
Aaron Judge | 14,854 | 52,271 | 0.28 | 3.5 years |
Michael Jordan | 23,744 | 116,763 | 0.20 | 4.9 years |
Bobby Witt Jr. | 6,934 | 35,844 | 0.19 | 5.2 years |
LeBron James | 7,550 | 43,566 | 0.17 | 5.8 years |
Ken Griffey Jr. | 11,212 | 73,870 | 0.15 | 6.6 years |
Tom Brady | 5,584 | 38,578 | 0.14 | 6.9 years |
Mike Trout | 4,951 | 52,972 | 0.09 | 10.7 years |
Nolan Ryan | 5,668 | 107,671 | 0.05 | 19.0 years |
This is why card context matters.
A dealer should not simply say:
“This is a famous player, so I can price above market.”
That is too simple.
A better question is:
“Is this a famous player with strong demand and manageable supply — or a famous player with so much supply that common cards still need to compete?”
Shohei Ohtani is a good example of strong player demand. He has huge supply, but he also has massive sales volume. That gives dealers more confidence, especially on better Ohtani cards.
Bobby Witt Jr. is also a known, in-demand player. But his listed supply is much heavier relative to sales. That means a strong Bobby Witt Jr. card can still deserve firm pricing, but a common base card should probably stay close to market or slightly below.
Nolan Ryan is an even clearer example. He is one of the most collectible names in baseball, but there is an enormous amount of Nolan Ryan inventory listed. For common Nolan Ryan base cards, name recognition alone is not enough to justify a premium.
The Best Ratios Point to Pricing Power
The players with the strongest demand / supply ratios are often the ones where dealers may have the most room to price at market or above market.
These are players where recent sales are strong compared with current active supply.
Examples from the report include:
Player | Sold Past Year | Active Listings | Demand / Supply Ratio | Approx. Years of Supply |
|---|---|---|---|---|
Fernando Mendoza | 627 | 286 | 2.19 | 0.5 years |
Macklin Celebrini | 738 | 619 | 1.19 | 0.8 years |
Cooper Flagg | 6,796 | 5,796 | 1.17 | 0.9 years |
Arch Manning | 684 | 670 | 1.02 | 1.0 years |
Konnor Griffin | 3,906 | 3,987 | 0.98 | 1.0 years |
Kon Knueppel | 3,989 | 4,882 | 0.82 | 1.2 years |
Lamine Yamal | 599 | 792 | 0.76 | 1.3 years |
Kevin McGonigle | 1,958 | 2,637 | 0.74 | 1.3 years |
Drake Maye | 12,351 | 21,887 | 0.56 | 1.8 years |
Victor Wembanyama | 10,541 | 19,151 | 0.55 | 1.8 years |
This is the kind of player demand that can support stronger pricing.
If a card belongs to one of these players, and the card itself has good context — rookie, desirable set, numbered parallel, short print, memorabilia, autograph, or limited supply — the dealer may have a real reason to price at market or modestly above market.
The key is that the player signal and card signal should work together.
A hot player plus a desirable card type is a stronger pricing opportunity.
A hot player plus a common base card may still sell, but the dealer should check supply and recent comps before adding a premium.
Set Also Changes the Pricing Context
The second layer of card context is the set.
A card is not just a player, a year, and a card number.
It is also part of a specific release.
That release can change buyer behavior.
Some sets are broad, mass-supply products. They have huge checklists, lots of active listings, and many similar cards competing for attention.
Other sets have a stronger collector hook. They may be artist-driven, event-driven, limited, premium, nostalgic, direct-to-consumer, or tied to a very specific hobby moment.
That difference matters for pricing.
To study this, we grouped cards by category and cleaned set name, then compared:
Total cards sold over the past year
Total active cards currently listed
Demand / supply ratio
Years of supply
Median market value
This set-level view is directional rather than player-matched, so it should be used as a pricing signal, not as proof that the set alone caused the higher demand. Some of the differences can come from player mix, checklist composition, release timing, novelty, or the type of collectors attracted to the product.
But even with that caveat, the set-level data is useful.
It shows how crowded the market is for a given set at the current sales pace.
The Strongest Sets Are Not Always the Biggest Sets
One of the clearest takeaways from the set-level data is that the strongest demand / supply ratios do not always come from the biggest mainstream releases.
In baseball, some of the strongest set-level ratios came from specialty Topps products:
Set | Sold Past Year | Active Listings | Demand / Supply Ratio | Approx. Years of Supply | Median Market Value |
|---|---|---|---|---|---|
Topps x Bob Ross: The Joy of Baseball | 1,412 | 1,677 | 0.84 | 1.19 years | $17.95 |
Topps Spotlight by Andy Friedman | 107 | 181 | 0.59 | 1.69 years | $2.99 |
Topps Project 2020 | 463 | 882 | 0.52 | 1.90 years | $8.69 |
Topps 50/50: Shohei Ohtani | 658 | 1,492 | 0.44 | 2.27 years | $4.99 |
Topps Now Off-Season | 193 | 492 | 0.39 | 2.55 years | $5.99 |
Topps Tier One | 315 | 835 | 0.38 | 2.65 years | $7.99 |
That is a useful pricing insight.
These are not all traditional flagship products.
Some are artist sets.
Some are event-driven sets.
Some are premium products.
Some are tied to a specific player story or collector moment.
But they all show something important:
A set with a clear collector hook can have stronger demand relative to supply than a generic mass-supply product.
That does not mean every card from those sets should be priced above market.
But it does mean the dealer should pause before treating those cards like ordinary base inventory.
Set Context Is Really Collector Intent
The reason set matters is not magic.
Set is a proxy for collector intent.
A buyer searching for a common base card may have many substitutes. If one copy is too expensive, they can buy another.
A buyer searching for a card from a specific artist set, premium release, commemorative set, or limited online product may be making a more targeted purchase.
That targeted intent can create better pricing power.
For example, a card from a set like Topps x Bob Ross or Topps Project 2020 is not competing only on player and market price. It is also competing on the collector appeal of the release itself.
A card from Topps 50/50: Shohei Ohtani is not just another Ohtani card. It is tied to a specific historic moment and a specific product concept.
A card from Topps Tier One carries a different expectation than a common base card because the product itself signals premium positioning.
The set tells the buyer what kind of card this is.
That should affect the dealer’s pricing confidence.
Mainstream Does Not Always Mean Stronger Pricing Power
This is also why dealers need to be careful with broad assumptions.
It is tempting to say:
“Topps Chrome is better than paper.”
Or:
“Prizm is always premium.”
Or:
“Flagship is always the safest.”
Those ideas are directionally useful, but they are incomplete.
A set’s pricing power depends on the category, the player mix, the supply already listed, and the reason collectors care about the release.
Topps Chrome in baseball may behave differently than Topps Chrome in football, basketball, soccer, wrestling, or racing.
Prizm may be a stronger product signal in basketball and football than in categories where collector demand is thinner.
A niche baseball set with a strong hook may show better demand / supply than a much larger mainstream release.
That is why we grouped by both category and set.
The question is not simply:
“Is this a good brand?”
The better question is:
“For this category, does this set have strong demand relative to the amount of inventory already listed?”
How Set Context Should Affect Pricing
Set context should be used as a confidence signal.
A card from a set with strong demand and limited supply may deserve firmer pricing, especially when the player and card type also support it.
A card from a heavily supplied set may still sell, but the dealer should be more cautious about pricing above market unless there is another reason.
The key is that set context does not replace market price.
It changes how much confidence a dealer should have in that price.
The set name is not just a label.
It is a demand signal.
It tells us whether the card belongs to a release collectors are actively chasing, ignoring, or already drowning in.
Then Look at the Card Itself
Player demand is the first layer.
Set demand is the next layer.
But the card itself is another layer.
To study that, we looked at several important card context flags:
RC: rookie card
AUTO: autograph
MEM: memorabilia
SN: serial numbered
At first, it may seem obvious that these cards should perform better.
But the better question is not simply:
“Do rookie cards sell better than non-rookie cards?”
The better question is:
“For the same player, do rookie cards, autos, memorabilia cards, or serial-numbered cards show stronger demand relative to supply than that player’s other cards?”
That distinction matters.
If we compare all rookie cards against all non-rookie cards globally, we may just be comparing different player mixes.
So we used a player-matched approach.
For each flag, we looked only at players who had both:
Cards with the flag
Cards without the flag
Then we calculated demand / supply inside each player group first.
Only after that did we summarize the results across all comparable players.
This gives a cleaner read on whether the card context itself changes the pricing environment.
What the Card Context Data Shows
Using the same demand / supply ratio, here is what the card-context data showed:
Flag | Flagged Demand / Supply Ratio | Flagged Years of Supply | Non-Flagged Demand / Supply Ratio | Non-Flagged Years of Supply | Flagged Median Market Value | Non-Flagged Median Market Value |
|---|---|---|---|---|---|---|
MEM | 0.21 | 4.8 years | 0.05 | 20.4 years | $3.00 | $1.49 |
SN | 0.08 | 12.3 years | 0.04 | 23.8 years | $1.99 | $1.34 |
RC | 0.06 | 17.9 years | 0.04 | 28.6 years | $1.46 | $1.38 |
AUTO | 0.06 | 17.9 years | 0.06 | 16.4 years | $1.87 | $1.50 |
The clearest signal was memorabilia.
MEM cards had a demand / supply ratio of 0.21, compared with 0.05 for non-MEM cards from the same comparable player set.
Said another way, MEM cards had roughly 4.8 years of listed supply at the current sales pace, compared with 20.4 years for non-MEM cards.
That is a meaningful difference.
It suggests that memorabilia cards often deserve a closer look before pricing aggressively low. They may have less supply, stronger collector intent, or both.
Serial-numbered cards also showed a positive signal.
SN cards had a demand / supply ratio of 0.08, compared with 0.04 for non-SN cards.
That means SN cards had roughly 12.3 years of listed supply, compared with 23.8 years for non-SN cards.
That is still a lot of supply, but it is a much better liquidity environment than the non-SN comparison group.
For dealers, this supports a simple rule:
A serial-numbered card should rarely be treated like a normal base card.
The rookie card signal was positive, but more moderate.
RC cards had a demand / supply ratio of 0.06, compared with 0.04 for non-RC cards.
That means RC cards had roughly 17.9 years of supply, compared with 28.6 years for non-RC cards.
So rookie cards generally performed better than non-rookie cards for the same players, but the signal was not strong enough to justify an automatic premium on every rookie card.
A common rookie card with a huge active supply can still be a competitive listing environment.
The autograph data was the most nuanced.
AUTO cards had a demand / supply ratio of 0.06, compared with 0.06 for non-AUTO cards.
In pooled demand / supply terms, autos did not show the same clear liquidity lift as MEM, SN, or RC.
But autos did have a higher median market value: $1.87 compared with $1.50 for non-auto cards.
That means autos may often be more valuable, but value and liquidity are not the same thing.
For autos, the dealer should be especially careful to check the specific player, signer demand, set, active supply, and recent comps.
The right takeaway is not:
“Always price autos above market.”
The better takeaway is:
“Autos can be valuable, but they still need card-level validation before adding a pricing premium.”
Market Value Also Changes With Context
The same player-matched analysis also showed that flagged cards often carry higher market values.
Memorabilia cards had a median market value of $3.00, compared with $1.49 for non-memorabilia cards.
Serial-numbered cards had a median market value of $1.99, compared with $1.34 for non-SN cards.
Autos had a median market value of $1.87, compared with $1.50 for non-auto cards.
Rookie cards had a smaller market-value lift: $1.46 compared with $1.38 for non-rookie cards.
That is useful because pricing strategy changes by value tier.
A $1.50 raw card and a $5 raw card should not always be handled the same way.
Higher-context cards often have higher market values, but the dealer still needs to consider liquidity.
A higher market price does not automatically mean faster sell-through.
The best pricing opportunities happen when both signals are positive:
The card has a stronger context signal
The card has healthy demand relative to active supply
How to Use Card Context in Pricing
Card context should act as a pricing modifier.
It should not replace market price.
Market price is still the anchor.
But card context tells us how much confidence to have in that anchor.
A simple way to use the signal:
Card Context | What the Data Suggests | Pricing Guidance |
|---|---|---|
MEM | Strongest demand / supply signal in this report | Check comps carefully; market or above-market pricing may be justified when supply is limited |
SN | Positive liquidity signal | Avoid treating as base; price firmly if recent comps and scarcity support it |
RC | Positive but moderate signal | Use as a confidence boost, not an automatic premium |
AUTO | Higher market value, but no clear pooled liquidity lift | Validate player, signer demand, set, and active supply before adding premium |
Base / no special context | Depends heavily on player demand and supply | Use market price as anchor; compete more aggressively when supply is heavy |
This gives dealers a better way to think about pricing.
A card does not deserve a premium just because it has a label.
It deserves stronger pricing when the label is supported by player demand, set demand, card scarcity, recent comps, and manageable active supply.
The cleanest signals in this report were MEM and SN.
RC was positive, but more moderate.
AUTO was valuable, but more nuanced.
That distinction matters.
The goal is not to blindly price every rookie, auto, memorabilia card, or serial-numbered card above market.
The goal is to identify when the card context creates real pricing power.
Not All Serial-Numbered Cards Behave the Same
Serial-numbered cards are not one single category.
A card numbered /999 is not the same pricing decision as a card numbered /99, /25, /10, or 1/1.
So we broke serial-numbered cards into rarity bands.
The goal was to answer a more specific question:
Which serial-number ranges show the strongest liquidity, and which mostly carry a value premium because of scarcity?
Here is what the data showed:
Serial Number Range | Sold Past Year | Active Listings | Demand / Supply Ratio | Approx. Years of Supply | Median Market Value |
|---|---|---|---|---|---|
1/1 | 293 | 6,820 | 0.04 | 23.3 years | $13.91 |
/2 - /5 | 264 | 3,894 | 0.07 | 14.8 years | $22.00 |
/6 - /10 | 932 | 13,567 | 0.07 | 14.6 years | $11.99 |
/11 - /25 | 2,587 | 25,228 | 0.10 | 9.8 years | $7.99 |
/26 - /50 | 5,461 | 50,200 | 0.11 | 9.2 years | $4.99 |
/51 - /99 | 16,161 | 117,718 | 0.14 | 7.3 years | $3.00 |
/100 - /199 | 22,652 | 154,256 | 0.15 | 6.8 years | $2.25 |
/200 - /299 | 18,013 | 120,782 | 0.15 | 6.7 years | $1.99 |
/300 - /499 | 12,819 | 100,212 | 0.13 | 7.8 years | $1.99 |
/500 - /999 | 7,558 | 69,832 | 0.11 | 9.2 years | $1.90 |
/1000 - /1999 | 1,523 | 20,584 | 0.07 | 13.5 years | $1.99 |
/2000 - /4999 | 6,055 | 130,711 | 0.05 | 21.6 years | $1.60 |
/5000 - /10000 | 828 | 9,830 | 0.08 | 11.9 years | $1.92 |
The most important takeaway is this:
Lower serial number does not automatically mean faster sell-through.
The rarest cards had the highest market values, but not the strongest liquidity.
For example, 1/1 cards had a median market value of $13.91, much higher than most other serial-numbered groups. But their demand / supply ratio was only 0.04, or roughly 23 years of supply at the current sales pace.
That does not mean 1/1 cards are bad.
It means they are different.
A 1/1 is often a higher-consideration purchase. The buyer pool is smaller, the price is higher, and the right collector may take longer to appear.
By contrast, the strongest liquidity was not at the very lowest print runs.
The best demand / supply ratios appeared around:
/51 - /99
/100 - /199
/200 - /299
/300 - /499
Those ranges had enough scarcity to matter, but enough availability and price accessibility to produce more frequent sales.
That is an important distinction for dealers.
A very low-numbered card may deserve a higher price because of scarcity.
But a mid-numbered serial card may actually have better sell-through because it sits in a more liquid part of the market.
How to Price Serial-Numbered Cards
Serial number should change how a dealer thinks about price, but not in a simple straight line.
The pricing rule is:
Lower serial number increases scarcity value.
Demand / supply ratio shows liquidity.
Market price remains the anchor.
A practical way to think about it:
Serial Number Range | What It Usually Means | Pricing Guidance |
|---|---|---|
1/1 | Maximum scarcity, narrow buyer pool | Do not race to the bottom; price based on comps, player strength, and uniqueness |
/2 - /10 | Very scarce, usually higher value | Price carefully; avoid discounting unless demand is weak or stale |
/11 - /50 | Strong scarcity with broader buyer pool | Often a good candidate for firm pricing if comps support it |
/51 - /299 | Best liquidity zone in this report | Price confidently when player demand is healthy |
/300 - /999 | Still meaningful context, but closer to mass supply | Use market price as anchor; premium needs support |
/1000+ | Technically numbered, but much less scarce | Treat closer to base unless player demand or set context is strong |
This is why serial-numbered cards need a two-part read.
A /5 card may be more valuable than a /199 card.
But the /199 card may sell faster.
For dealers, that means the pricing decision should depend on the goal.
If the goal is to maximize price and the card is genuinely scarce, the dealer can afford to be patient.
If the goal is faster sell-through, mid-numbered cards may be easier to move because they combine scarcity, affordability, and broader collector demand.
The mistake is treating every serial-numbered card the same.
A 1/1, a /25, a /99, and a /499 all have different pricing dynamics.
The serial number should not just tell the dealer that the card is special.
It should tell the dealer what kind of special it is.
Year Also Changes the Pricing Context
Year is another important layer of card context.
The year-level data shows a few clear patterns.
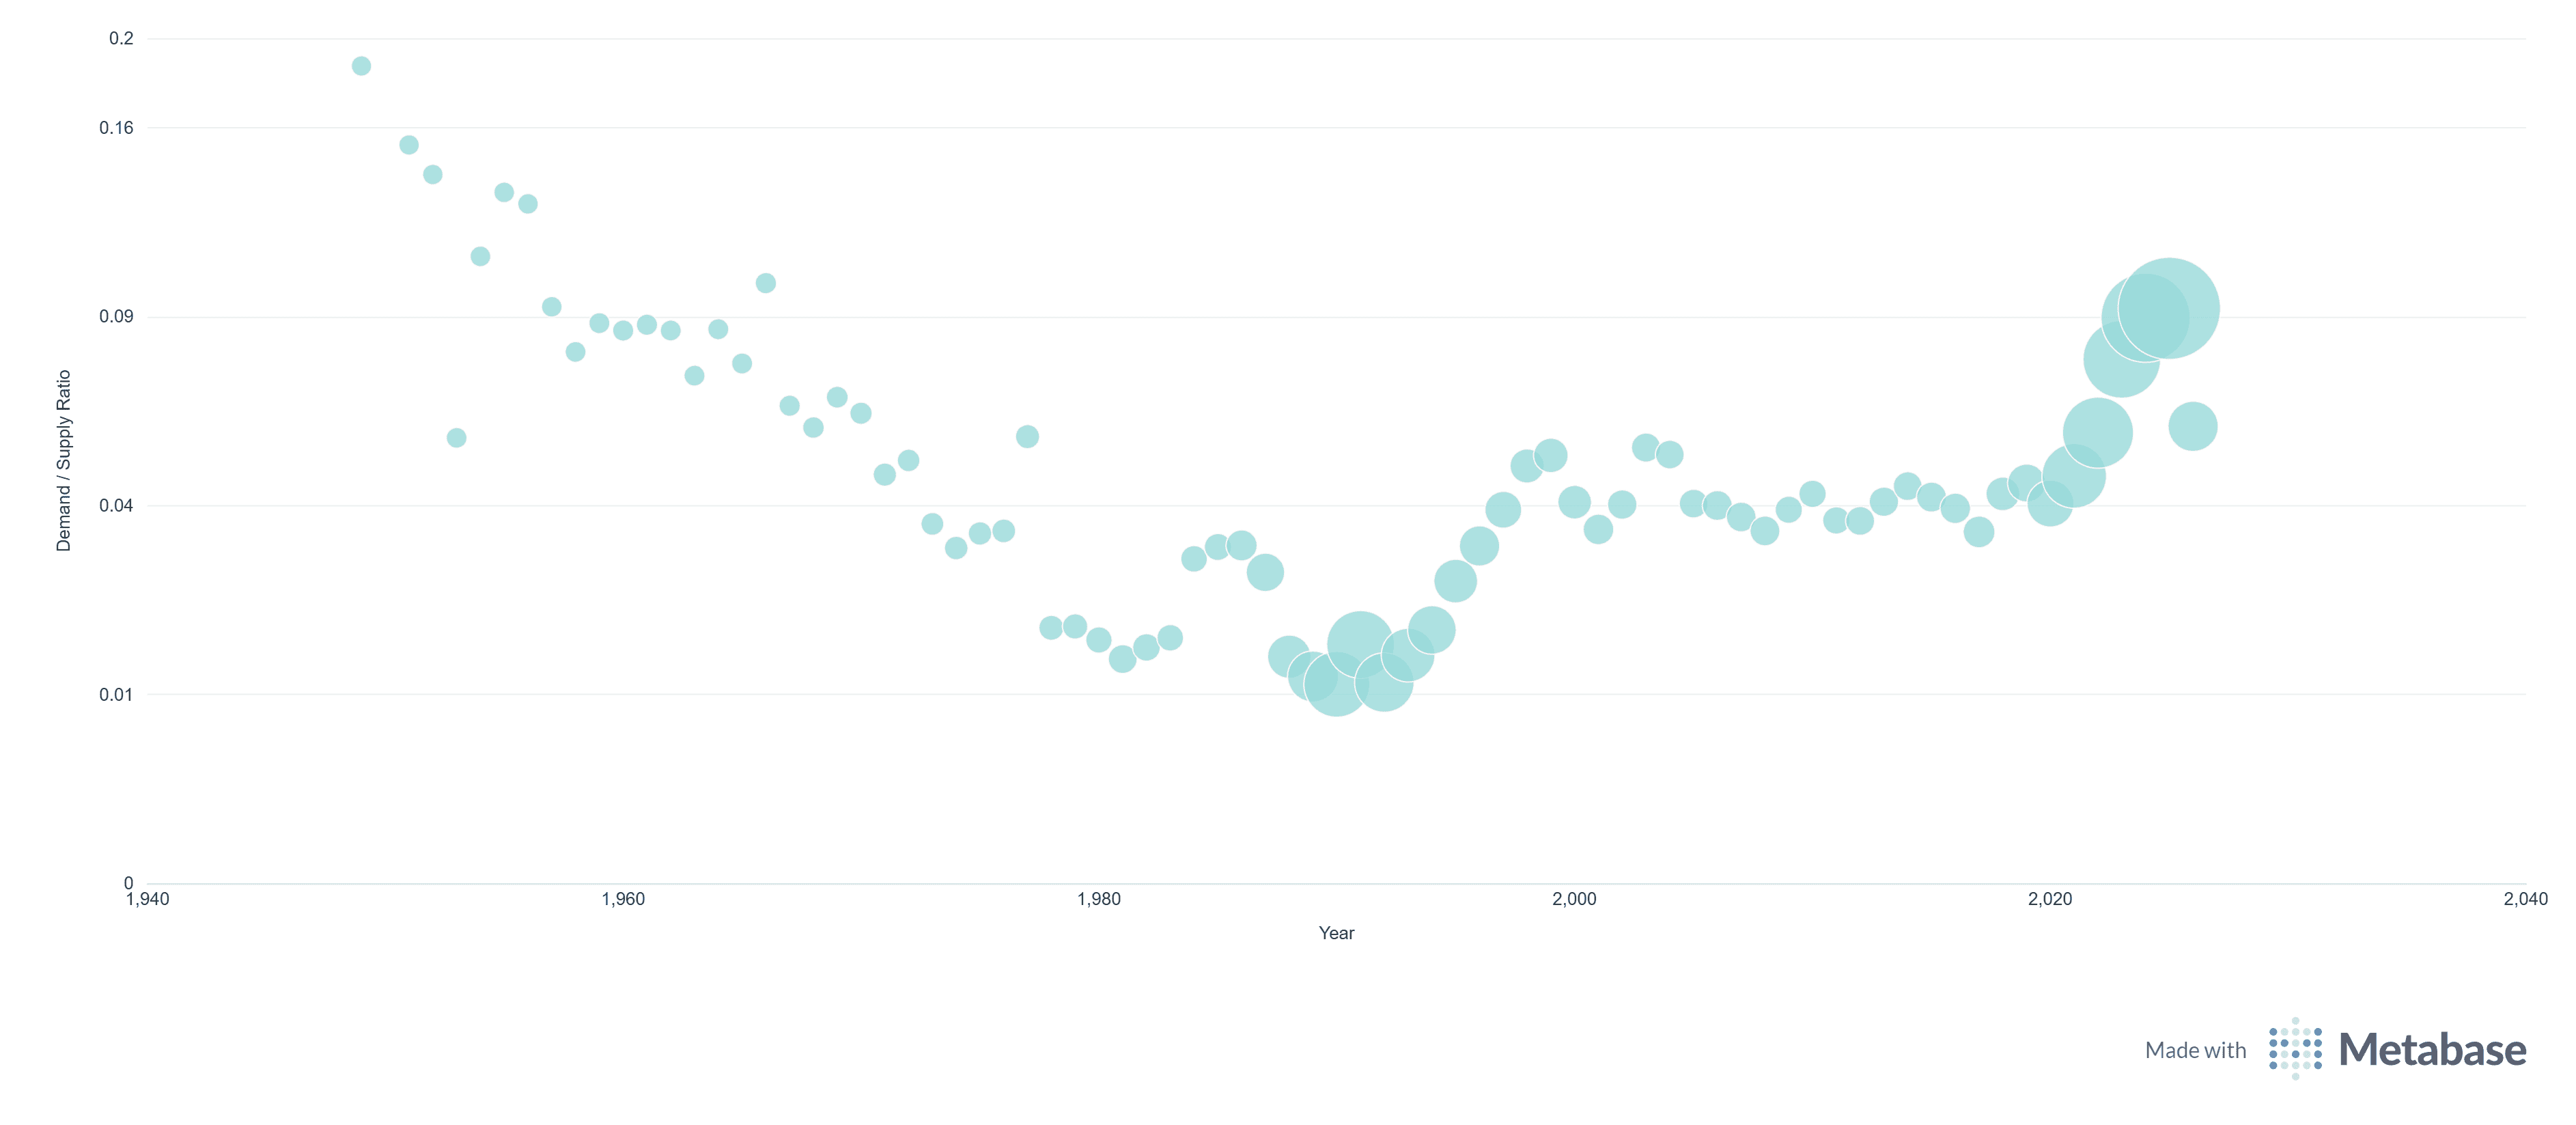
Recent cards are highly liquid because they are tied to current releases, active breaks, rookie chases, and fresh collector attention. In this report, 2025 cards had a demand / supply ratio of 0.08, while 2024 cards were close behind at 0.07. That is meaningfully stronger than many older modern years.
But the pattern is not simply “newer is always better.”
The strongest older years were clustered in the vintage period, especially the 1950s and early 1960s. Those years had much lower total supply, and even modest sales volume created strong demand / supply ratios. That tells us vintage cards can have real pricing power when supply is thin.
The weakest area was the late 1980s and early 1990s. Years like 1988, 1989, 1990, 1991, and 1992 had very low demand / supply ratios because there is so much active supply relative to current sales. That is the clearest oversupply zone in the report.
The rule of thumb is:
Recent years often have stronger current demand. Vintage years can have pricing power because supply is limited. Junk-wax and overproduced years need more aggressive pricing unless the card has a strong player, rookie, scarcity, set, or condition reason.
So dealers should not treat year as just a catalog field.
Year should influence pricing confidence.
A 2025 card of a hot player may deserve firmer pricing because buyers are actively searching for current releases.
A 1950s or early 1960s card may deserve patience because supply is limited.
But a common card from the late 1980s or early 1990s should usually stay close to market, sell as part of a lot, or require a very strong card-specific reason to justify a premium.
Applying This to Bobby Witt Jr.
This brings us back to the Bobby Witt Jr. example.
Bobby Witt Jr. is not a no-name player.
He is a known, highly collected young star with thousands of sales over the past year.
That matters.
But the player-demand data also shows that Bobby Witt Jr. has a lot of active supply relative to sales. His player-level demand / supply ratio is around 0.19, which is roughly five years of supply at the current sales pace.
That means the player name gives the card real demand.
But the supply environment limits how aggressive a dealer should be.
So the pricing question becomes:
Which Bobby Witt Jr. card is it?
A dealer should think differently about:
A common Bobby Witt Jr. Rookie Debut base card
A more desirable Bobby Witt Jr. flagship rookie
A Topps Chrome version
A Bowman or Bowman Chrome card
A card from a specialty or limited release
A numbered parallel
A short print or image variation
An autograph
A memorabilia card
A card from a new release
A card with unusually low active supply
A card tied to a recent performance spike
The set matters too.
A Bobby Witt Jr. Topps Chrome card, Topps flagship card, Bowman card, Topps Now card, or specialty release may each sit in a different demand environment.
The Rookie Debut card has some positive context.
It is a rookie-year card.
It features a known player.
It has real sales activity.
But it is also a common base card with a lot of competition.
That points to a clear pricing recommendation:
Strong player, common card, heavy supply. Use market price as the anchor, but be careful about pricing above market unless another signal supports it.
For a better Bobby Witt Jr. card — flagship rookie, Chrome, Bowman, numbered parallel, short print, memorabilia, autograph, or stronger set context — the same player demand may support stronger pricing.
That is why card context is so important.
The player tells us there is demand.
The set tells us whether collectors are actively chasing the release.
The card attributes tell us whether the card has special appeal.
The supply environment tells us how much pricing power we actually have.
The Pricing Rule
The final pricing rule is simple:
Market price is the anchor. Player demand sets the confidence level. Set and card context determine whether the card deserves a premium, a normal price, or a discount.
A dealer should not blindly price every rookie, auto, memorabilia card, serial-numbered card, or specialty-set card above market.
But a dealer also should not treat those cards like ordinary base cards.
The better approach is:
Start with market price.
Check player demand relative to supply.
Check set context.
Check card flags and scarcity.
Check year and release timing.
Check recent comps.
Price more firmly only when the signals work together.
When the player is strong, supply is manageable, and the card has meaningful context, the dealer may have pricing power.
When the player is famous but supply is heavy, or when the card is common despite the name, the dealer should stay closer to market or price competitively.
That is the core lesson of card context.
The card itself should change your price — but only when the data says the context actually matters.