The Raw Card Pricing Playbook - Part 4 - Liquidity
Cass Sapir
Two raw cards can both show the same market price — but that does not mean they should be listed at the same price. One card might have hundreds of active copies competing for buyer attention. Another might have limited supply and steady recent sales. In Part 4 of the Raw Card Pricing Playbook, we add the next layer: liquidity.

Liquidity: Why Supply and Demand Should Change Your Card Price
Two raw cards can both have the same market price.
That does not mean they should get the same listing price.
One $3 card might have hundreds of active listings and slowing demand.
Another $3 card might have limited supply and steady recent sales.
Those are very different pricing situations.
In Part 4 of the Raw Card Pricing Playbook, we are adding the next layer: liquidity.
Market price tells you what similar cards have sold for.
Liquidity tells you how hard it may be to sell your copy right now.
The Big Question
Most dealers start with a simple question:
What is this card worth?
That is important.
But it is not enough.
A better pricing question is:
How much demand is there compared to how much supply is currently available?
That is where liquidity comes in.
For this article, we looked at three key signals:
How many copies of a card are currently active for sale
How many copies sold over the past year
How sales changed across recent 90-day windows
The pricing rule is simple:
High demand and low supply can justify a higher price. Weak demand and heavy supply require a more aggressive price.
What We Studied
For this analysis, we looked at CollX marketplace liquidity by canonical card ID.
For each card, the report included:
Current active listings on CollX
Total sold over the past year
Demand / supply ratio
Sales in the last 90 days
Sales in the prior 90 days
Sales from 181 to 270 days ago
Sales from 271 to 365 days ago
Current median market price
The demand / supply ratio is calculated as:
Total sold over the past year ÷ current active listings
So if a card sold 100 times in the past year and has 50 active listings, the demand / supply ratio is 2.0.
If a card sold 100 times and has 200 active listings, the ratio is 0.5.
That difference matters.
Why Liquidity Matters
A market price is a backward-looking anchor.
Liquidity is a current selling condition.
If a card has strong demand and limited active supply, the dealer may not need to undercut the market. The card is moving, buyers are active, and available copies may be limited.
If a card has heavy supply and weak recent demand, the dealer has a different problem. Even if the market price says $3.99, there may be dozens or hundreds of competing copies. In that case, pricing too high can leave the card sitting.
This is why two cards with the same market value can deserve different listing prices.
The Simple Liquidity Framework
Here is the dealer version.
Liquidity Situation | What It Means | Pricing Guidance |
|---|---|---|
High demand / thin supply | Sales are strong relative to active listings | Price at market or modestly above |
Healthy demand / moderate supply | Demand is real, but there is competition | Stay near market; use clean pricing |
Heavy supply / steady demand | The card sells, but many copies are available | Avoid premiums; price competitively |
Heavy supply / weak recent demand | Too many copies, not enough recent sales | Price aggressively or use offers |
Demand fading | Recent sales are slowing compared to prior periods | Do not chase old comps |
Demand rising | Recent sales are improving | Market or modest premium may be justified |
The key point:
Liquidity tells you how much confidence you should have in your asking price.
A High-Liquidity Example
One of the strongest examples in the report was:
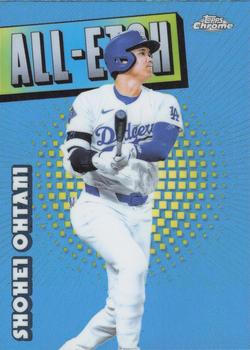
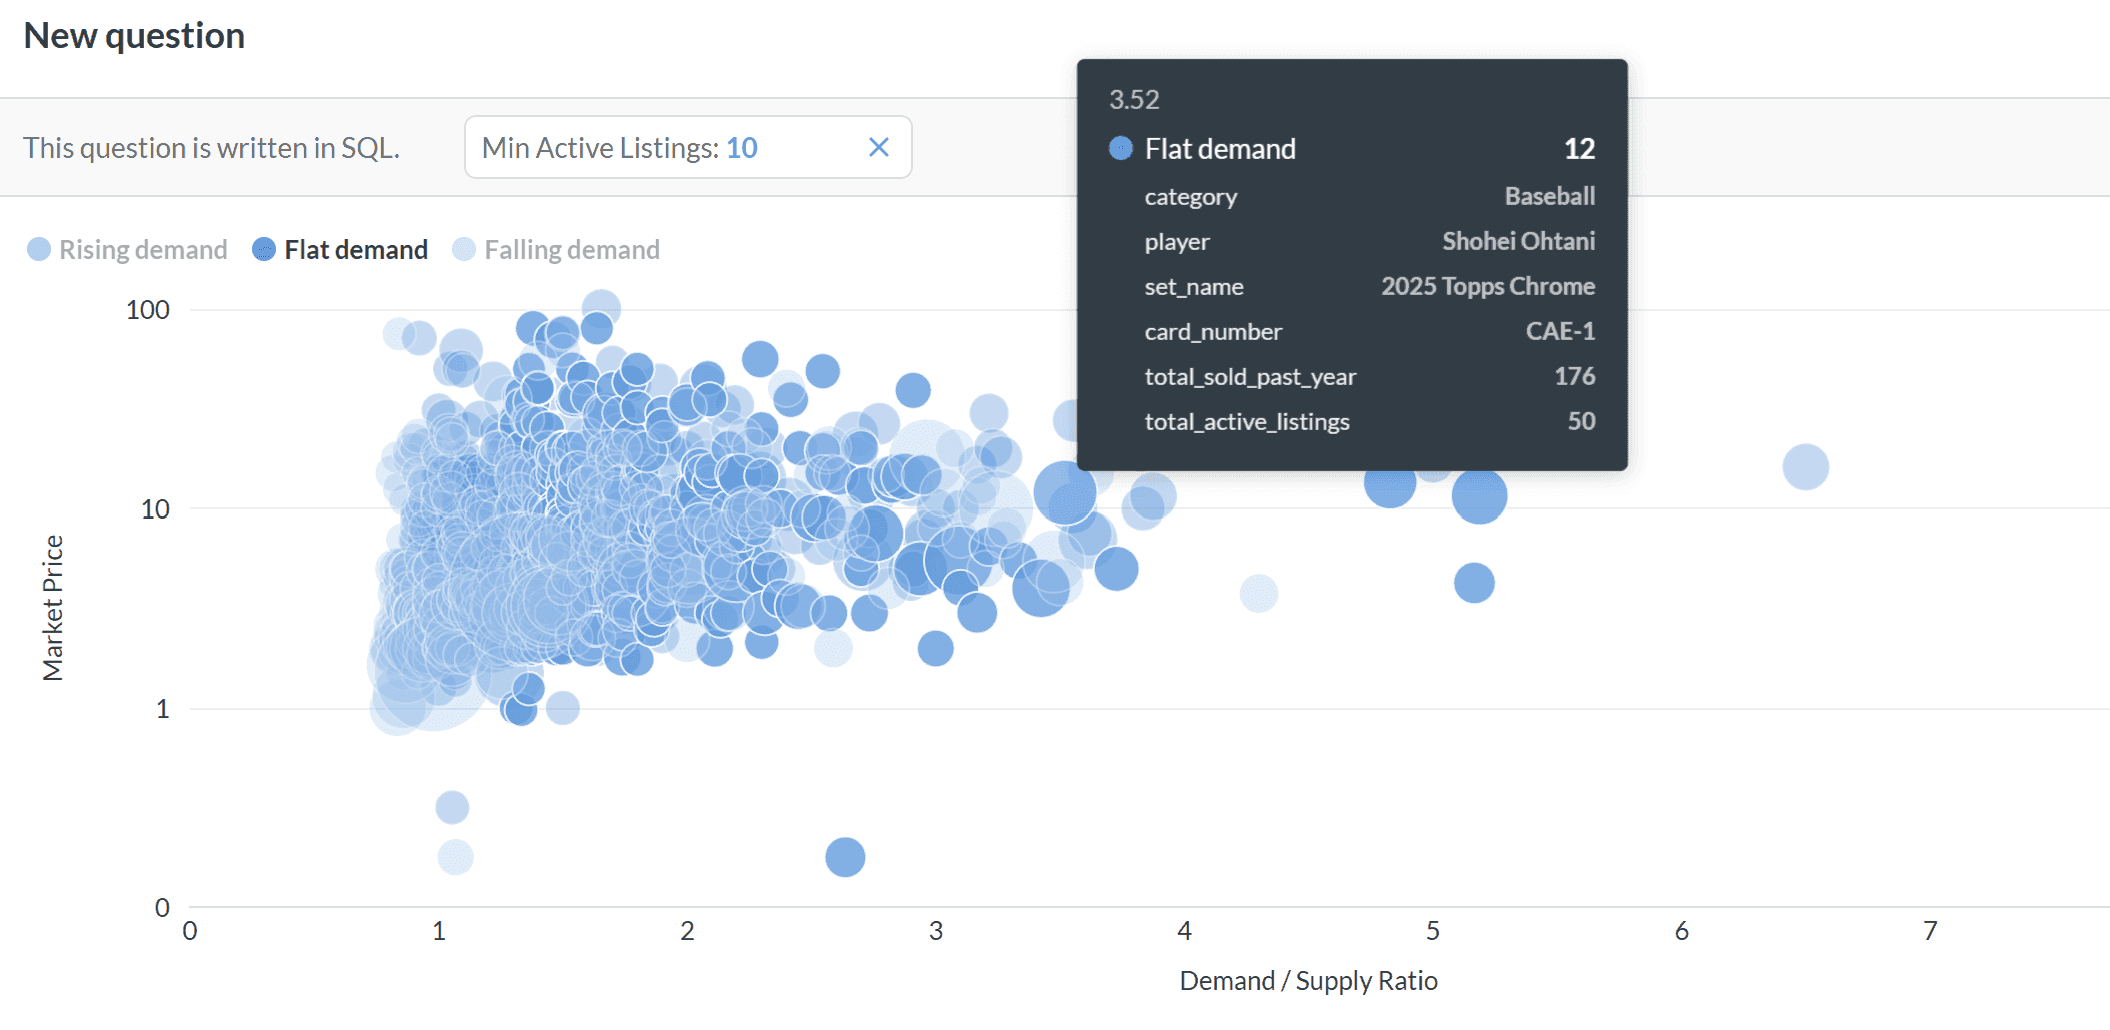
Shohei Ohtani — 2025 Topps Chrome #CAE-1
The card had:
$12.00 median market price
176 sold over the past year
50 active listings
3.52 demand / supply ratio
59 sold in the last 90 days
63 sold in the prior 90 days
This is a healthy liquidity profile.
There is meaningful current supply, but demand is strong relative to that supply. The card is not relying on one random sale. It has a strong market price sample, steady recent sales, and enough buyer interest to support confidence.
For a card like this, a dealer does not necessarily need to be the cheapest listing.
A reasonable pricing approach might be:
Price near market for a clean sale
Price modestly above market if the copy is sharp, well-photographed, or the dealer is willing to wait
Avoid panic-discounting unless the goal is immediate velocity
Best rule:
When demand is strong relative to supply, do not race to the bottom.
A Heavy-Supply Example
Now compare that with a lower-liquidity Bobby Witt Jr. example from the report:
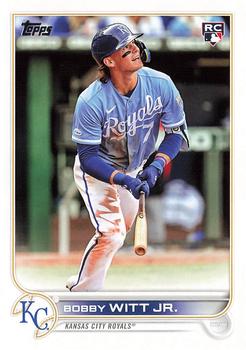
Bobby Witt Jr. — 2022 Topps Update #US100
The card had:
$3.99 Med10 market price
84 sold over the past year
205 active listings
0.41 demand / supply ratio
22 sold in the last 90 days
39 sold in the prior 90 days
8 sold from 181 to 270 days ago
15 sold from 271 to 365 days ago
This card has real demand.
It is Bobby Witt Jr. It is a Topps Update card. It has a strong number of sales behind the market price.
But it also has a lot of active supply.
There are 205 active listings against 84 sales over the past year. That means the dealer is competing with a lot of other copies.
This is not a card where a dealer should blindly price above market and expect it to move quickly.
A reasonable pricing approach might be:
$3.99 if staying at market and willing to wait
$2.99 or $3.49 if the goal is faster movement
Use offers or markdowns if the card sits
Avoid pricing at a premium unless the copy has a clear reason
Best rule:
When supply is heavy, the market price may still be real — but the listing needs to compete.
Why Recent Sales Windows Matter
The past-year sold number is useful, but it can hide changes in demand.
That is why we also looked at sales in 90-day windows.
For example, a card might show:
80 sold over the past year
40 sold in the last 90 days
10 sold in the prior 90 days
That suggests demand may be rising.
Another card might show:
80 sold over the past year
5 sold in the last 90 days
40 sold in the prior 90 days
That suggests demand may be fading.
Dealers should care about that.
A stale comp can make a card look stronger than it is. A recent demand spike can make a card more attractive than its older average suggests.
The sales window helps answer:
Is demand still there, or are we pricing off old momentum?
Demand Rising vs. Demand Fading
Liquidity is not just about total demand.
It is also about direction.
Demand Rising
If a card sold more recently than it did in the prior 90-day window, the dealer may have more pricing flexibility.
This can happen when:
A player gets hot
A prospect is called up
A team makes a playoff run
A product becomes newly popular
A card gets social or collector attention
Dealer guidance:
If demand is rising and supply is not overwhelming, stay near market or test a modest premium.
Demand Fading
If a card sold much less recently than it did in the prior window, the dealer should be more careful.
This can happen when:
Hype fades
A player cools off
A new product replaces an older one
Supply catches up
Collectors move on to another card
Dealer guidance:
If demand is fading, do not price off the best old comp. Price for today’s market.
How This Applies to the Bobby Witt Jr. Example
Let’s bring this back to the Bobby Witt Jr. card.
A dealer might see a market price around $3.99 and think:
This is a $3.99 card.
But the liquidity data adds more context.
For the Bobby Witt Jr. 2022 Topps Update example in this report, there were:
84 sold over the past year
205 active listings
22 sold in the last 90 days
39 sold in the prior 90 days
0.41 demand / supply ratio
That changes the pricing conversation.
The card is not dead. It sells.
But it is also not scarce. Buyers have choices.
So the dealer should not think only:
What is the market price?
The dealer should think:
How many copies am I competing against?
Are recent sales strong enough to support my price?
Do I want speed or margin?
Does my copy have anything that makes it better than the others?
Should I price at market, below market, or use offers?
For a heavily supplied Bobby Witt Jr. card, a premium price should require a reason.
If there is no reason, the safer pricing strategy is to stay clean, competitive, and buyer-friendly.
The Liquidity Pricing Playbook
Here is the practical dealer framework.
If demand is high and supply is low
Use market price as the floor, not the ceiling.
Good approach:
Price at market
Price modestly above market for strong copies
Do not automatically undercut
Let the card work for you
Best fit:
Hot players
Recent demand spikes
Cards with limited active supply
Cards with strong recent sales
If demand is healthy and supply is moderate
Use market price as the anchor.
Good approach:
Price around market
Use clean price endings
Adjust based on condition and photos
Use offers if the card sits
Best fit:
Popular stars
Good rookies
Cards with steady buyer interest
If demand is real but supply is heavy
Compete more carefully.
Good approach:
Avoid aggressive premiums
Consider pricing slightly below market
Use offers or markdowns
Make sure photos and titles are strong
Refresh stale listings
Best fit:
Popular but common cards
Mass-produced rookies
Base stars
Cards with many active copies
If demand is weak and supply is heavy
Do not force an individual listing strategy.
Good approach:
Price aggressively
Bundle or lot
Use clearance pricing
Skip individual listing if the economics do not work
Best fit:
Low-end base
Oversupplied modern cards
Fading hype cards
Cards with little recent sales activity
Important Caution
Liquidity is not the same thing as value.
A card can have high demand and still be cheap.
A card can be valuable and still be illiquid.
A card can have a strong market price but too much active supply.
That is why liquidity should not replace market price.
It should sit next to it.
The best pricing decisions combine:
Market value
Market value tier
Price type
Current supply
Recent demand
Card context
This is how dealers move from “what is the comp?” to “what is the right price for this listing?”
Recommendation for Dealers
Pricing should not only reflect market price.
It should also reflect liquidity.
For each card, dealers should know:
Current active listings
Sold in the last 90 days
Sold in the prior 90 days
Sold over the past year
Demand / supply ratio
Demand trend
Liquidity bucket
Then translate that into a strategy for the card.
For example:
Liquidity Signal | Pricing Recommendation |
|---|---|
High demand / thin supply | Price at or above market |
Demand rising | Consider modest premium |
Demand steady | Price near market |
Heavy supply | Price competitively |
Demand fading | Avoid old high comps |
Weak demand / heavy supply | Discount, lot, or skip |
The goal is not to replace dealer judgment.
The goal is to make the pricing decision clearer.
What Comes Next
This article covered the fourth dimension of smarter pricing:
Liquidity: Supply vs. Demand.
Next, we will look at the fifth dimension:
Card Context.
A card’s price is not only shaped by market value, price type, and liquidity. It is also shaped by what the card actually is:
Player
Rookie status
Set
Parallel
Rarity
Condition
Hype
Collector demand
That is the final layer of the Raw Card Pricing Playbook.
Final Takeaway
Market price tells you what a card has sold for.
Liquidity tells you how competitive the listing is right now.
A card with strong demand and limited supply can often support a stronger price.
A card with heavy supply and weak demand needs a more aggressive strategy.
The dealer rule is simple:
Do not price from market value alone. Price from market value plus liquidity.
That is how dealers avoid underpricing cards buyers want — and avoid overpricing cards buyers can easily find somewhere else.