The Raw Card Pricing Playbook - Part 3 - Price Type
Cass Sapir
We analyzed millions of raw CDP listings to find out which price types actually sell: whole dollars, half dollars, .99 pricing, .95 pricing, and weird exact-penny prices.

Price Type: Should You Price Cards at $1.99, $2.00, $2.50, or Something Weird?
Most dealers spend a lot of time thinking about what a card is worth.
Fewer spend enough time thinking about how the price looks.
But for low-end raw cards, the price ending matters. A card listed at $1.99, $2.00, $2.50, and $2.37 may all be “around two bucks,” but buyers do not necessarily respond to those prices the same way.
More importantly, dealers do not use those prices the same way.
That is why Part 3 of the Raw Card Pricing Playbook focuses on a deceptively simple question:
What kind of price should you use?
The Card We Will Follow
For this article, let’s go back to our running example:
2022 Topps Update Bobby Witt Jr. Rookie Debut #US187 — raw, ungraded
Imagine CDP shows a raw market price of $1.87.
What should the dealer do?
List it at $1.87?
Round to $1.99?
Use a clean $2.00?
Try $2.49?
Push to $2.99?
Use some exact penny price like $2.13?
That may sound like a small decision.
But across millions of listings, those small decisions add up.
The Question
We wanted to understand whether different price types perform differently.
So we analyzed millions of raw, ungraded cards listed through Card Dealer Pro and grouped them by pricing style:
Whole dollars
Half dollars
Quarter pricing
.99 pricing
.49 pricing
.95 pricing
Other 9-ending prices
Exact penny / nonstandard prices
The goal was simple:
Which price types produce the best sell-through and revenue per listed card?
What We Studied
This analysis focused only on raw, ungraded cards.
To keep the data clean, we used the same safeguards from our broader pricing research:
Raw / ungraded cards only
Cards actually listed through CDP
Listings created in the past 365 days
Listings from the most recent 30 days excluded, so every card had time to sell
Cards with real sale prices
Cards with real raw market prices
Raw market prices based on at least 5 sales
Extreme sale-to-market outliers removed
Then we grouped sale prices into common dealer pricing styles.
The Price Types We Compared
Price Type | Examples |
|---|---|
Whole Dollar | $1.00, $2.00, $5.00, $10.00 |
Half Dollar | $0.50, $1.50, $2.50, $4.50 |
Quarter Pricing | $1.25, $1.75, $2.25, $3.75 |
99-Cent Charm | $0.99, $1.99, $2.99, $4.99 |
49-Cent Charm | $1.49, $2.49, $3.49 |
95-Cent Charm | $4.95, $9.95, $19.95 |
Other 9-Ending | $1.09, $1.19, $1.29, $1.89 |
Exact Penny / Nonstandard | $1.37, $2.14, $3.82 |
The Results
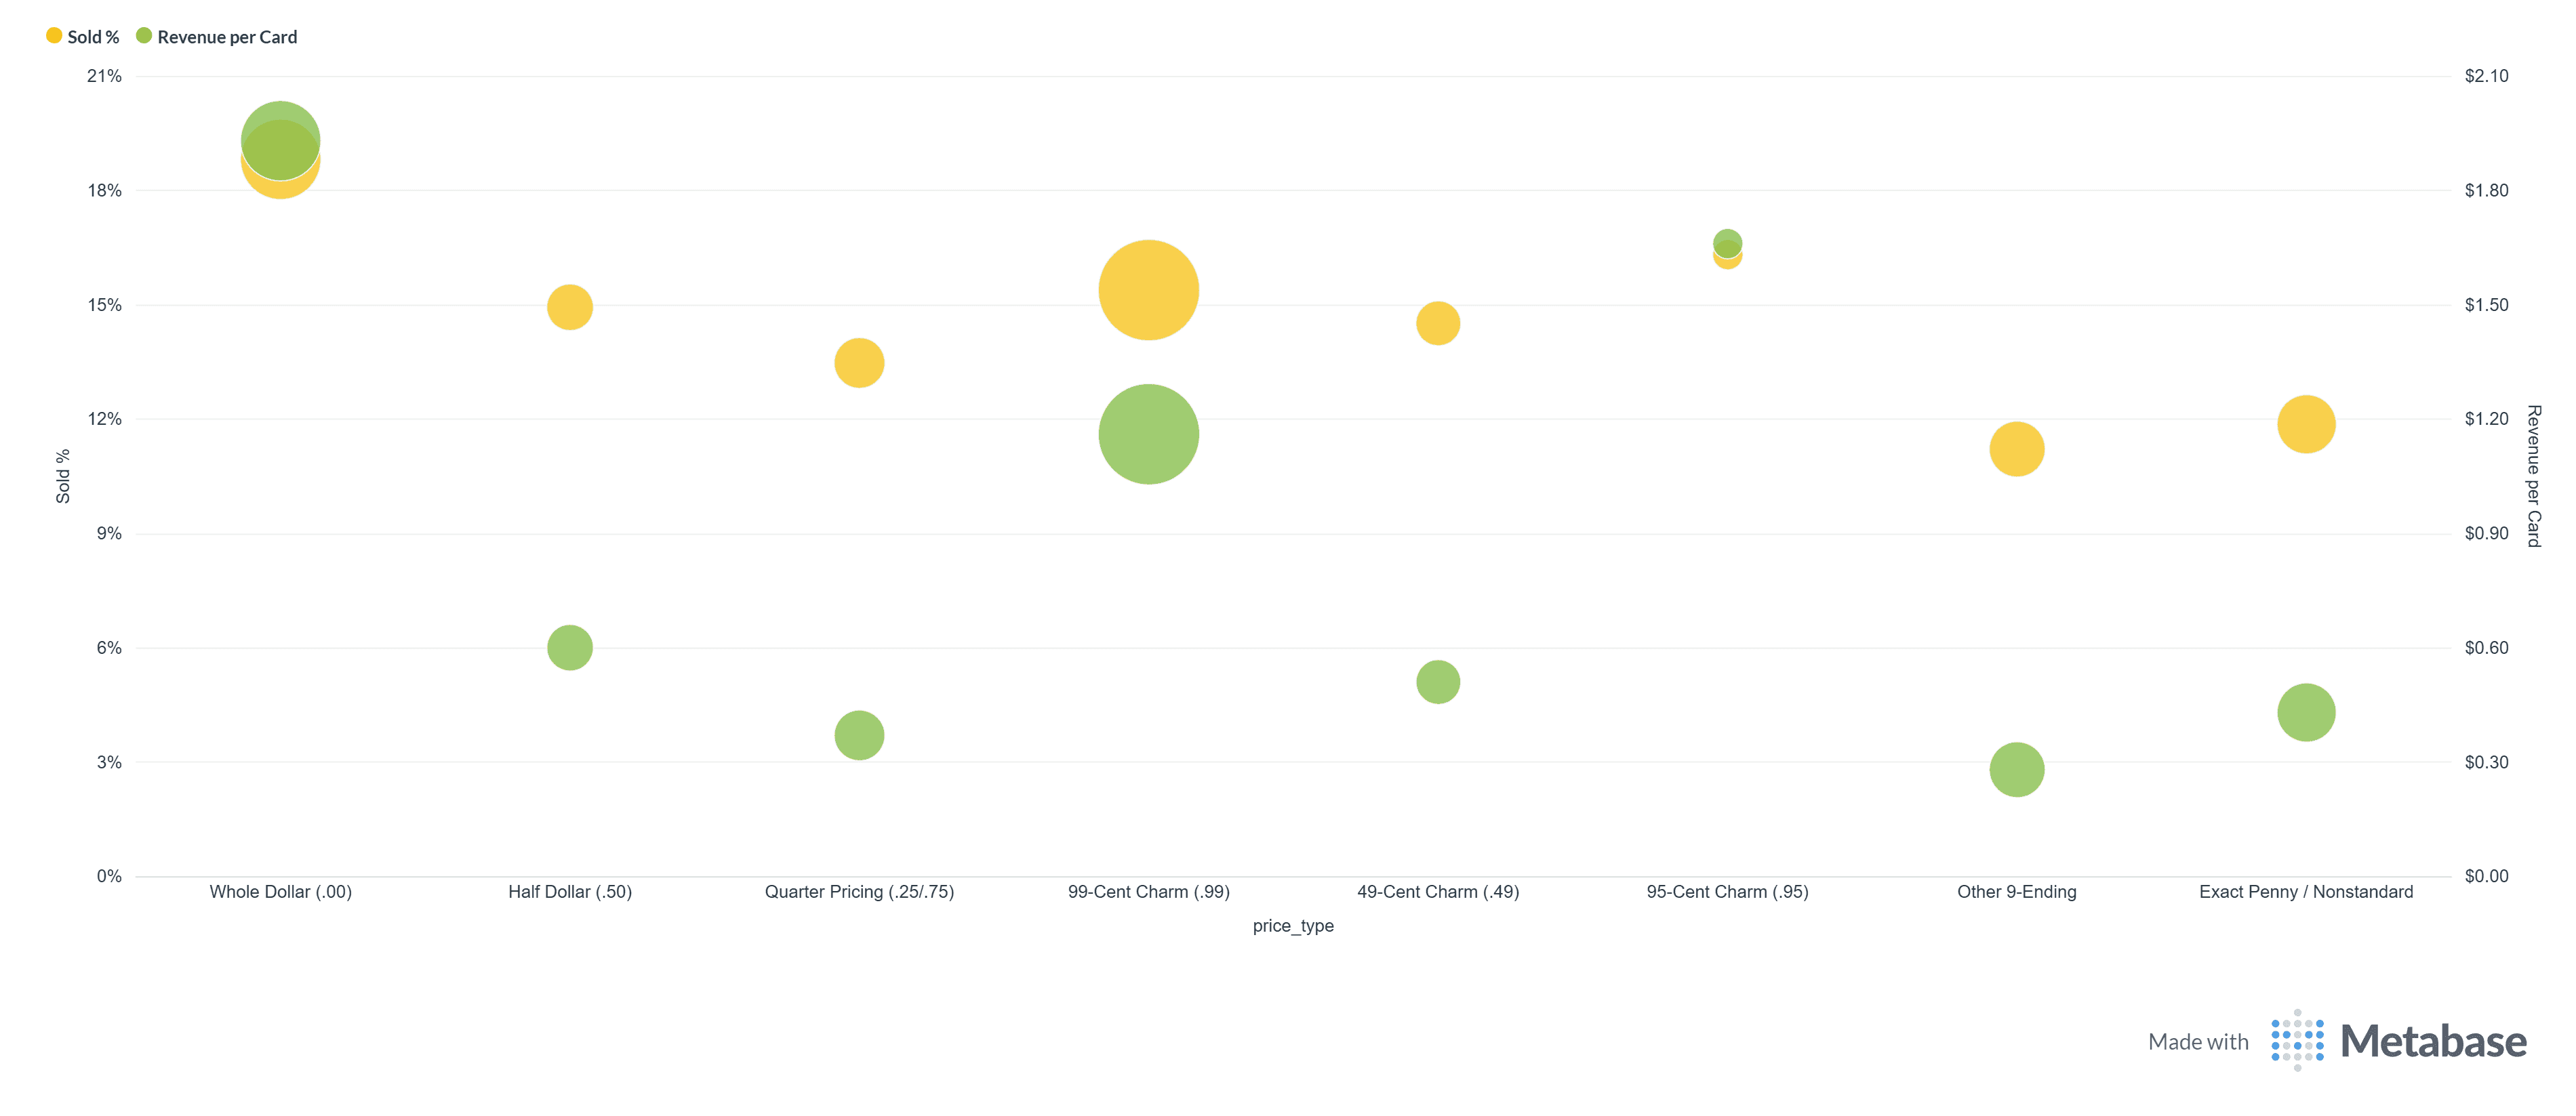
Here is what we saw across the full raw-card dataset:
Price Type | Listed Cards | Sold Cards | Sold % | Revenue / Listed Card | Avg Sale Price |
|---|---|---|---|---|---|
Whole Dollar (.00) | 1,567,387 | 293,446 | 18.72% | $1.93 | $5.50 |
95-Cent Charm (.95) | 132,642 | 21,584 | 16.27% | $1.66 | $8.91 |
99-Cent Charm (.99) | 2,560,620 | 392,380 | 15.32% | $1.16 | $3.65 |
Half Dollar (.50) | 460,009 | 68,553 | 14.90% | $0.60 | $2.33 |
49-Cent Charm (.49) | 416,857 | 60,208 | 14.44% | $0.51 | $2.18 |
Quarter Pricing (.25/.75) | 564,521 | 75,907 | 13.45% | $0.37 | $1.90 |
Exact Penny / Nonstandard | 805,291 | 95,077 | 11.81% | $0.43 | $2.20 |
Other 9-Ending | 707,458 | 79,120 | 11.18% | $0.28 | $1.88 |
The Big Finding
The data points to a simple rule:
Clean, familiar prices perform better than weird prices.
Whole-dollar pricing had the strongest overall result:
18.72% sell-through
$1.93 in quantity-adjusted revenue per listed card
The most common pricing style, .99 pricing, also performed well:
2.56 million listed cards
15.32% sell-through
$1.16 in revenue per listed card
By contrast, the weakest-performing styles were the messy ones:
Other 9-ending prices sold at only 11.18%
Exact penny / nonstandard prices sold at only 11.81%
That means prices like $1.29, $1.89, $2.14, and $3.82 underperformed more familiar prices like $1.99, $2.00, and $2.50.
The practical takeaway:
Do not over-optimize to the penny. Price clearly.
Why Whole-Dollar Pricing Looked So Strong
Whole-dollar pricing was the best-performing group overall.
But we should be careful with the interpretation.
Whole-dollar cards had a much higher average sale price:
Whole Dollar avg sale price: $5.50
99-Cent avg sale price: $3.65
Exact Penny avg sale price: $2.20
Other 9-Ending avg sale price: $1.88
That means dealers may be using whole-dollar prices on better cards.
A $10 card priced at $10.00 is not the same kind of listing as a $1.29 card.
So the takeaway is not necessarily:
Price every card at a whole dollar.
The better takeaway is:
Whole-dollar pricing is clean, trusted, and works especially well as card values rise.
Whole-dollar pricing seems to fit cards where the buyer is evaluating the card more seriously and where the dealer wants the price to feel firm, clean, and intentional.
Examples:
$5.00
$8.00
$10.00
$15.00
$20.00
These prices feel simple. They do not look algorithmic or messy. They suggest confidence.
Why .99 Still Matters
The .99 bucket was the largest in the dataset:
2,560,620 listed cards
392,380 sold cards
That alone matters.
Dealers use .99 because it works, especially for low-end cards.
A $2.99 card feels meaningfully different from a $3.00 card, even though the difference is only one cent. Buyers are used to .99 pricing. It signals retail-style value, and it works well in search results, marketplaces, and buyer scanning behavior.
The data supports .99 as a safe default:
15.32% sold
$1.16 revenue per listed card
Large sample size
Broad dealer adoption
For low-end raw cards, .99 pricing remains one of the best default tools.
Examples:
$0.99
$1.99
$2.99
$3.99
$4.99
$9.99
For our Bobby Witt Jr. Rookie Debut example, if the market price is $1.87, a dealer might choose $1.99 as the clean near-market price or $2.99 if the card is recognizable, worth listing individually, and the dealer wants to protect margin.
The Surprise: .95 Performed Well, But Use Caution
The .95 bucket looked strong:
16.27% sell-through
$1.66 revenue per listed card
$8.91 average sale price
That is a good result, but the sample is much smaller:
132,642 listed cards
It also appears to skew toward higher-priced cards. Dealers may be using .95 on more valuable or more intentionally priced inventory, such as $9.95, $14.95, or $19.95 cards.
So .95 is worth testing, but it should not automatically replace .99.
Best use cases:
$4.95
$9.95
$14.95
$19.95
This can work well when you want the card to feel slightly discounted, but not cheap.
Half-Dollar Pricing Is Fine, But Not the Best Default
Half-dollar pricing had solid, middle-of-the-pack performance:
14.90% sell-through
$0.60 revenue per listed card
Examples:
$0.50
$1.50
$2.50
$4.50
This type of pricing is simple and easy to understand. It can work well for bargain bins, show pricing, or low-end inventory.
But in the data, it did not outperform whole-dollar or .99 pricing.
Use it when you want prices to feel simple and flexible.
Do not make it your default if you are optimizing marketplace performance.
For the Bobby Witt Jr. example, $1.50 might make sense if the dealer wants speed. But if the goal is a clean marketplace listing, $1.99 is probably the more natural price.
Quarter Pricing Was Weaker
Quarter pricing underperformed:
13.45% sell-through
$0.37 revenue per listed card
Examples:
$1.25
$1.75
$2.25
$3.75
This may work in physical bargain boxes, but online it may not be as clean. These prices are easy for sellers to create, but they do not seem to produce stronger marketplace outcomes.
Dealer guidance:
Use quarter pricing sparingly online.
Avoid Random Penny Pricing
The clearest negative signal was for messy, nonstandard prices.
Exact Penny / Nonstandard pricing:
805,291 listed cards
11.81% sell-through
$0.43 revenue per listed card
Other 9-Ending pricing:
707,458 listed cards
11.18% sell-through
$0.28 revenue per listed card
Examples to avoid:
$1.13
$1.29
$1.37
$1.89
$2.14
$2.67
$3.82
These prices may come from automated calculations, percentage adjustments, imports, or sellers trying to price exactly against comps.
But to buyers, they can look awkward.
They are harder to process. They do not feel like standard retail pricing. And in this analysis, they performed worse.
The lesson:
Do not over-optimize to the penny.
For the Bobby Witt Jr. card, if the market price is $1.87, that does not mean the listing should be $1.87.
A cleaner price like $1.99 or $2.99 will usually make more sense.
The Dealer Price-Type Playbook
For Low-End Cards Under $5
Use familiar retail prices.
Best options:
$0.99
$1.99
$2.99
$3.99
$4.99
Use .99 as the default when the card is low-end but worth listing individually.
Avoid:
$1.17
$1.29
$1.44
$2.13
$3.68
For the Bobby Witt Jr. Rookie Debut card, this means the real decision is probably not between $1.87 and $1.89.
It is more likely between:
$1.99 if staying close to market
$2.99 if protecting margin
$3.99 only if demand is strong or the dealer is willing to wait
For Cards Around $5 to $20
Use either .99, .95, or clean whole dollars.
Good options:
$5.00
$5.99
$7.99
$9.95
$9.99
$10.00
$14.95
$14.99
$19.95
$19.99
This is where price psychology and shipping economics both matter. A card priced at $19.99 can feel more attractive than $20.00 and may also keep the listing under an important buyer/search/shipping threshold.
For Cards Over $20
Use cleaner pricing.
Good options:
$25.00
$29.99
$35.00
$39.99
$50.00
$75.00
$99.99
At this level, the buyer is not deciding because of one cent. They are judging the card, the photos, the seller, and the comps.
Whole-dollar pricing becomes more natural as the card gets more valuable.
For Premium Cards
Use intentional pricing.
Good options:
$100.00
$125.00
$149.99
$150.00
$199.99
$200.00
$249.99
Do not use weird penny prices on premium cards.
A $147.36 card looks less intentional than $149.99 or $150.00.
Product Recommendation for Dealers
If you are listing raw cards at scale, use price endings intentionally.
Default low-end pricing
Use:
.99
Examples:
$1.99
$2.99
$3.99
$4.99
Clean dealer pricing
Use:
Whole dollars
Examples:
$5.00
$10.00
$15.00
$20.00
Promotional / bargain pricing
Use selectively:
.50
.95
Examples:
$2.50
$4.50
$9.95
$19.95
Avoid
Random penny prices and odd 9-ending prices.
Examples:
$1.29
$1.89
$2.14
$3.82
How This Applies to Bobby Witt Jr. #US187
Let’s bring it back to the example card:
2022 Topps Update Bobby Witt Jr. Rookie Debut #US187 — raw, ungraded
If CDP shows a market price of $1.87, the dealer should not think:
Market is $1.87, so list at $1.87.
Instead, the dealer should think:
This is a low-end raw single
It is recognizable enough to list individually
It probably deserves a clean price ending
Exact penny pricing may look awkward
The right price depends on the dealer’s goal
A reasonable price-type decision might look like:
Dealer Goal | Better Price Type | Example Price |
|---|---|---|
Fast movement | Half-dollar or .99 | $1.50 or $1.99 |
Balanced listing | .99 or whole dollar | $1.99 or $2.00 |
Margin protection | .99 | $2.99 |
Weird precision | Avoid | $1.87, $2.13, $2.37 |
The point is simple:
The price should look intentional.
What Comes Next
This article covered the third dimension of smarter pricing:
Price Type / Price Ending.
Next, we will look at the fourth dimension:
Liquidity: Supply vs. Demand.
Two cards can both have the same market value, but one may have hundreds of copies available and weak recent sales while another has limited supply and strong demand.
Those cards should not get the same price.
Final Takeaway
For raw cards, especially low-end singles, the data is clear:
Use clean, familiar prices.
Whole-dollar prices had the strongest overall performance.
.99 pricing was the most widely used and performed well at scale.
.95 pricing showed promise, especially for higher-value cards.
The weakest results came from random penny prices and odd 9-ending prices.
So the practical dealer rule is simple:
Use .99 for low-end singles. Use clean whole-dollar pricing for stronger cards. Use .95 or .50 selectively. Avoid weird penny prices.
The best dealers do not just price accurately.
They price clearly.